Examples#
In the ‘examples’ subfolder, we provide sample codes using PathFinder. These are summarised below:
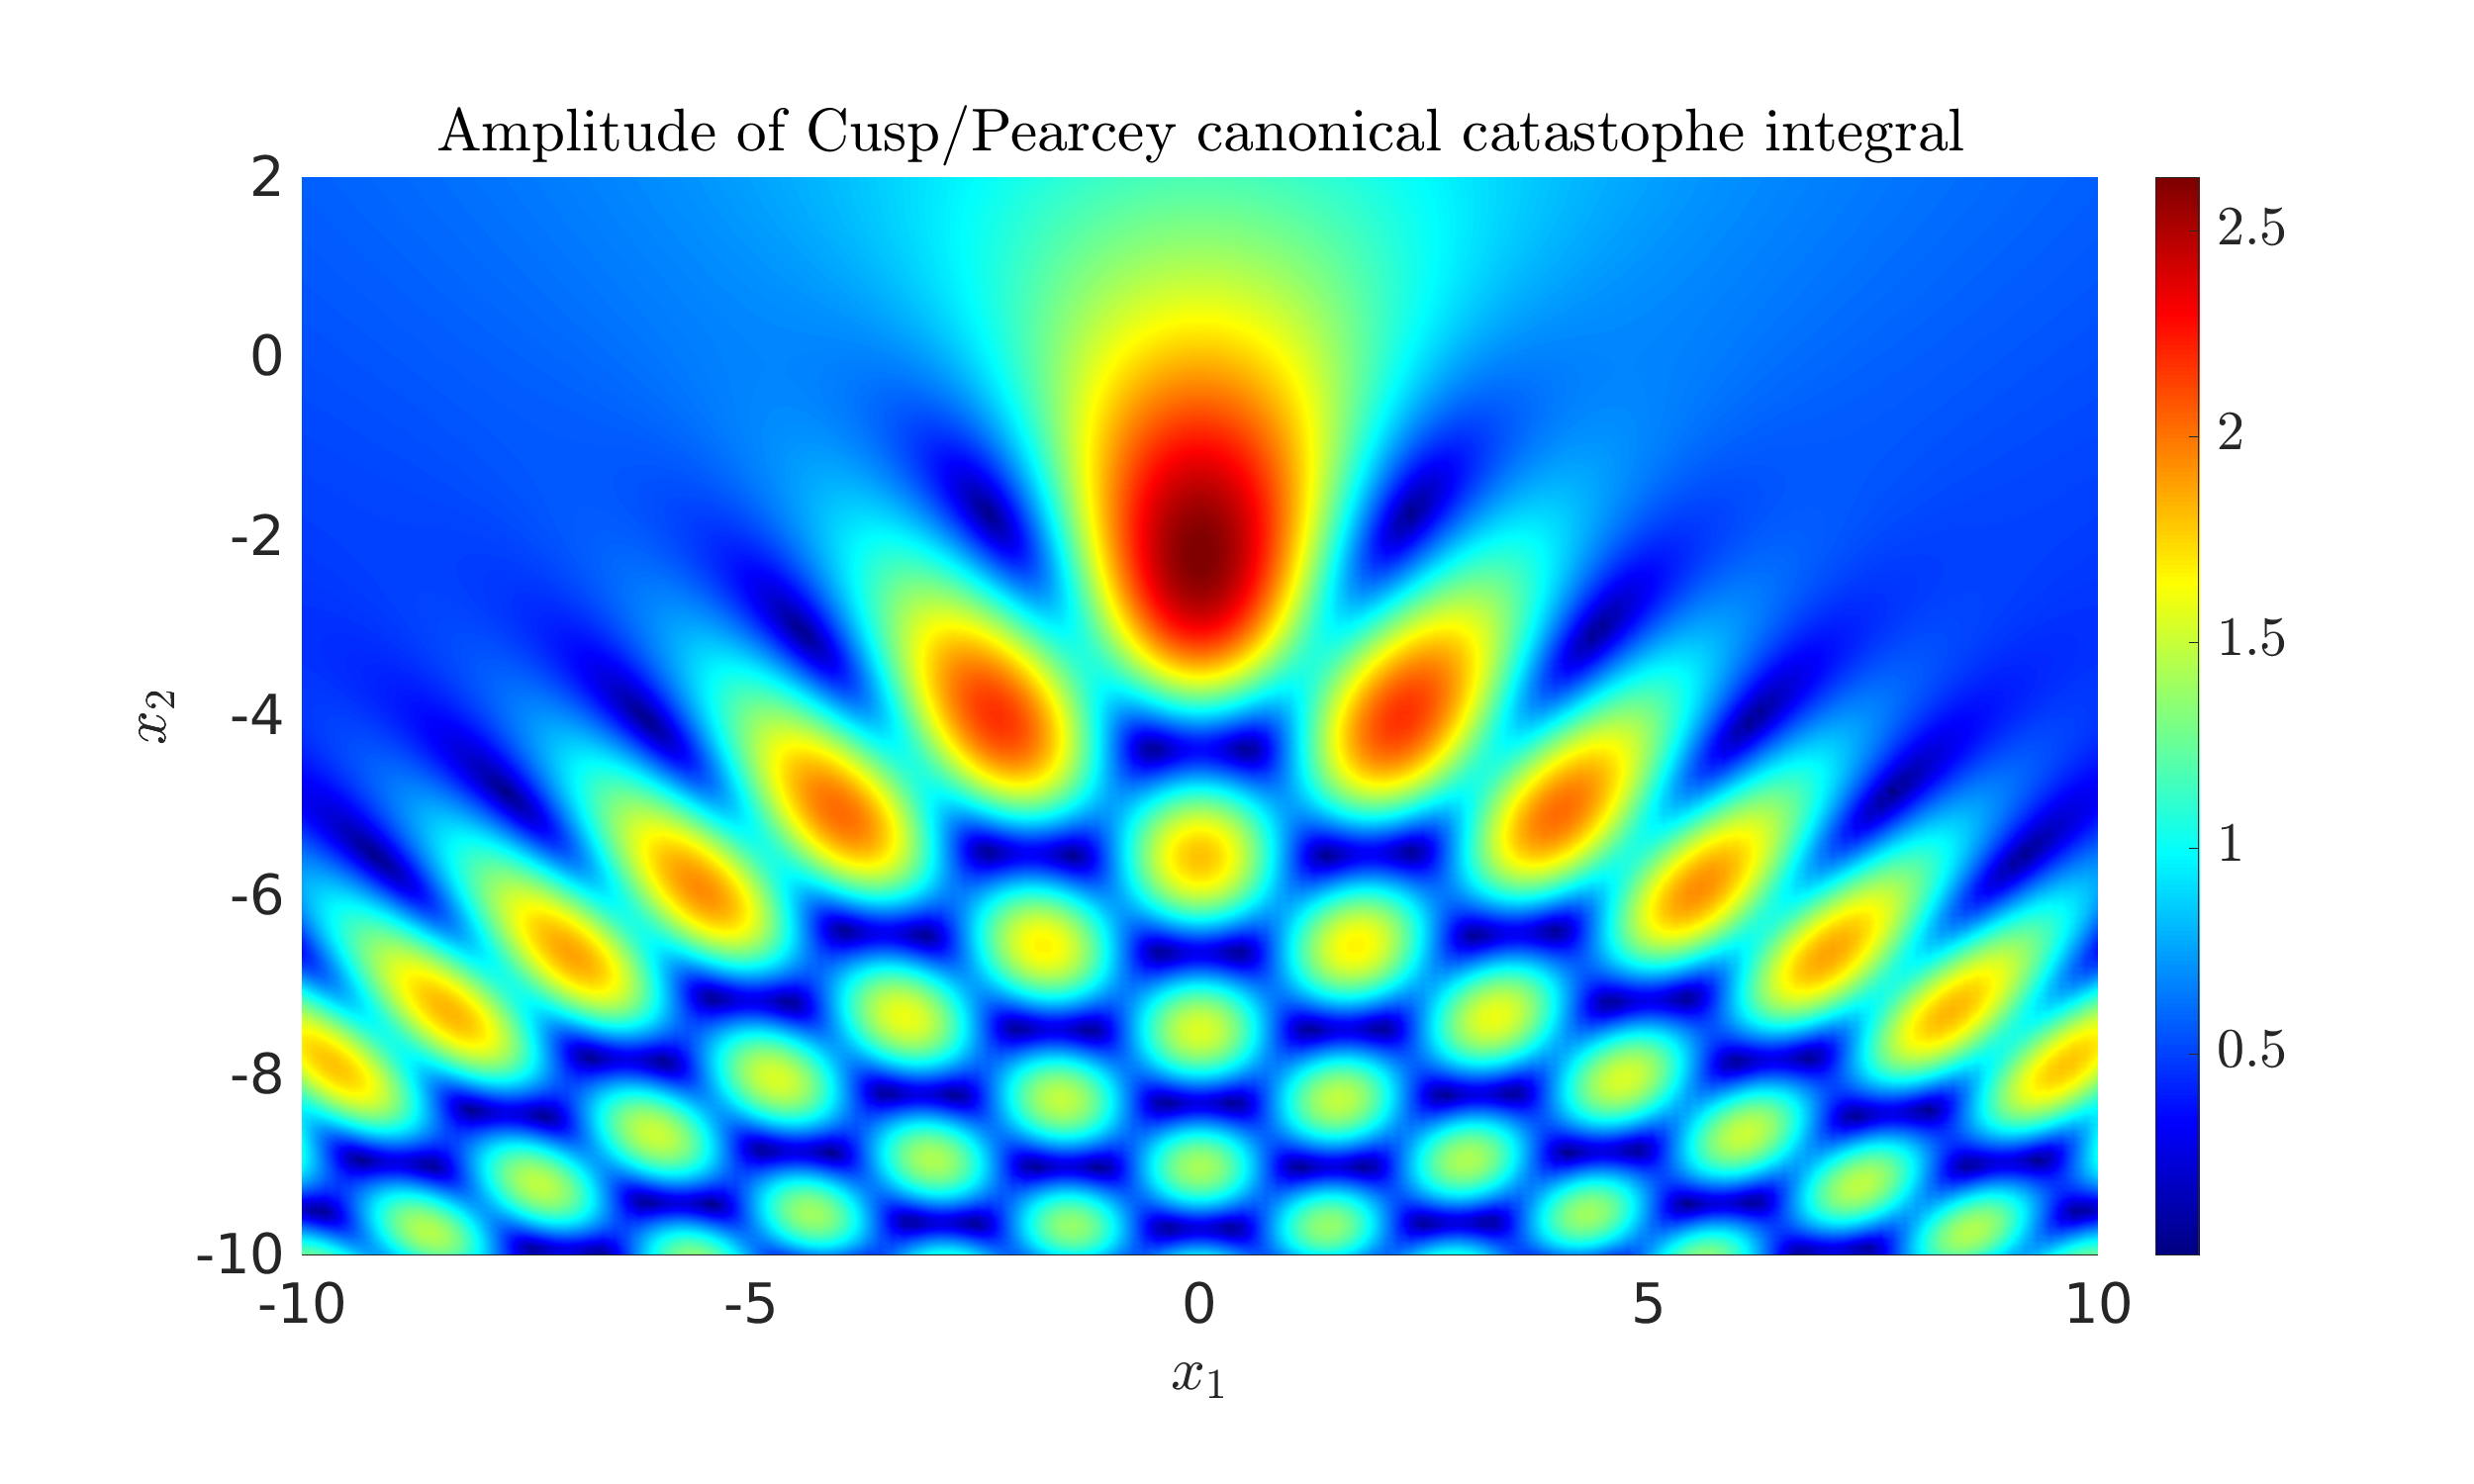
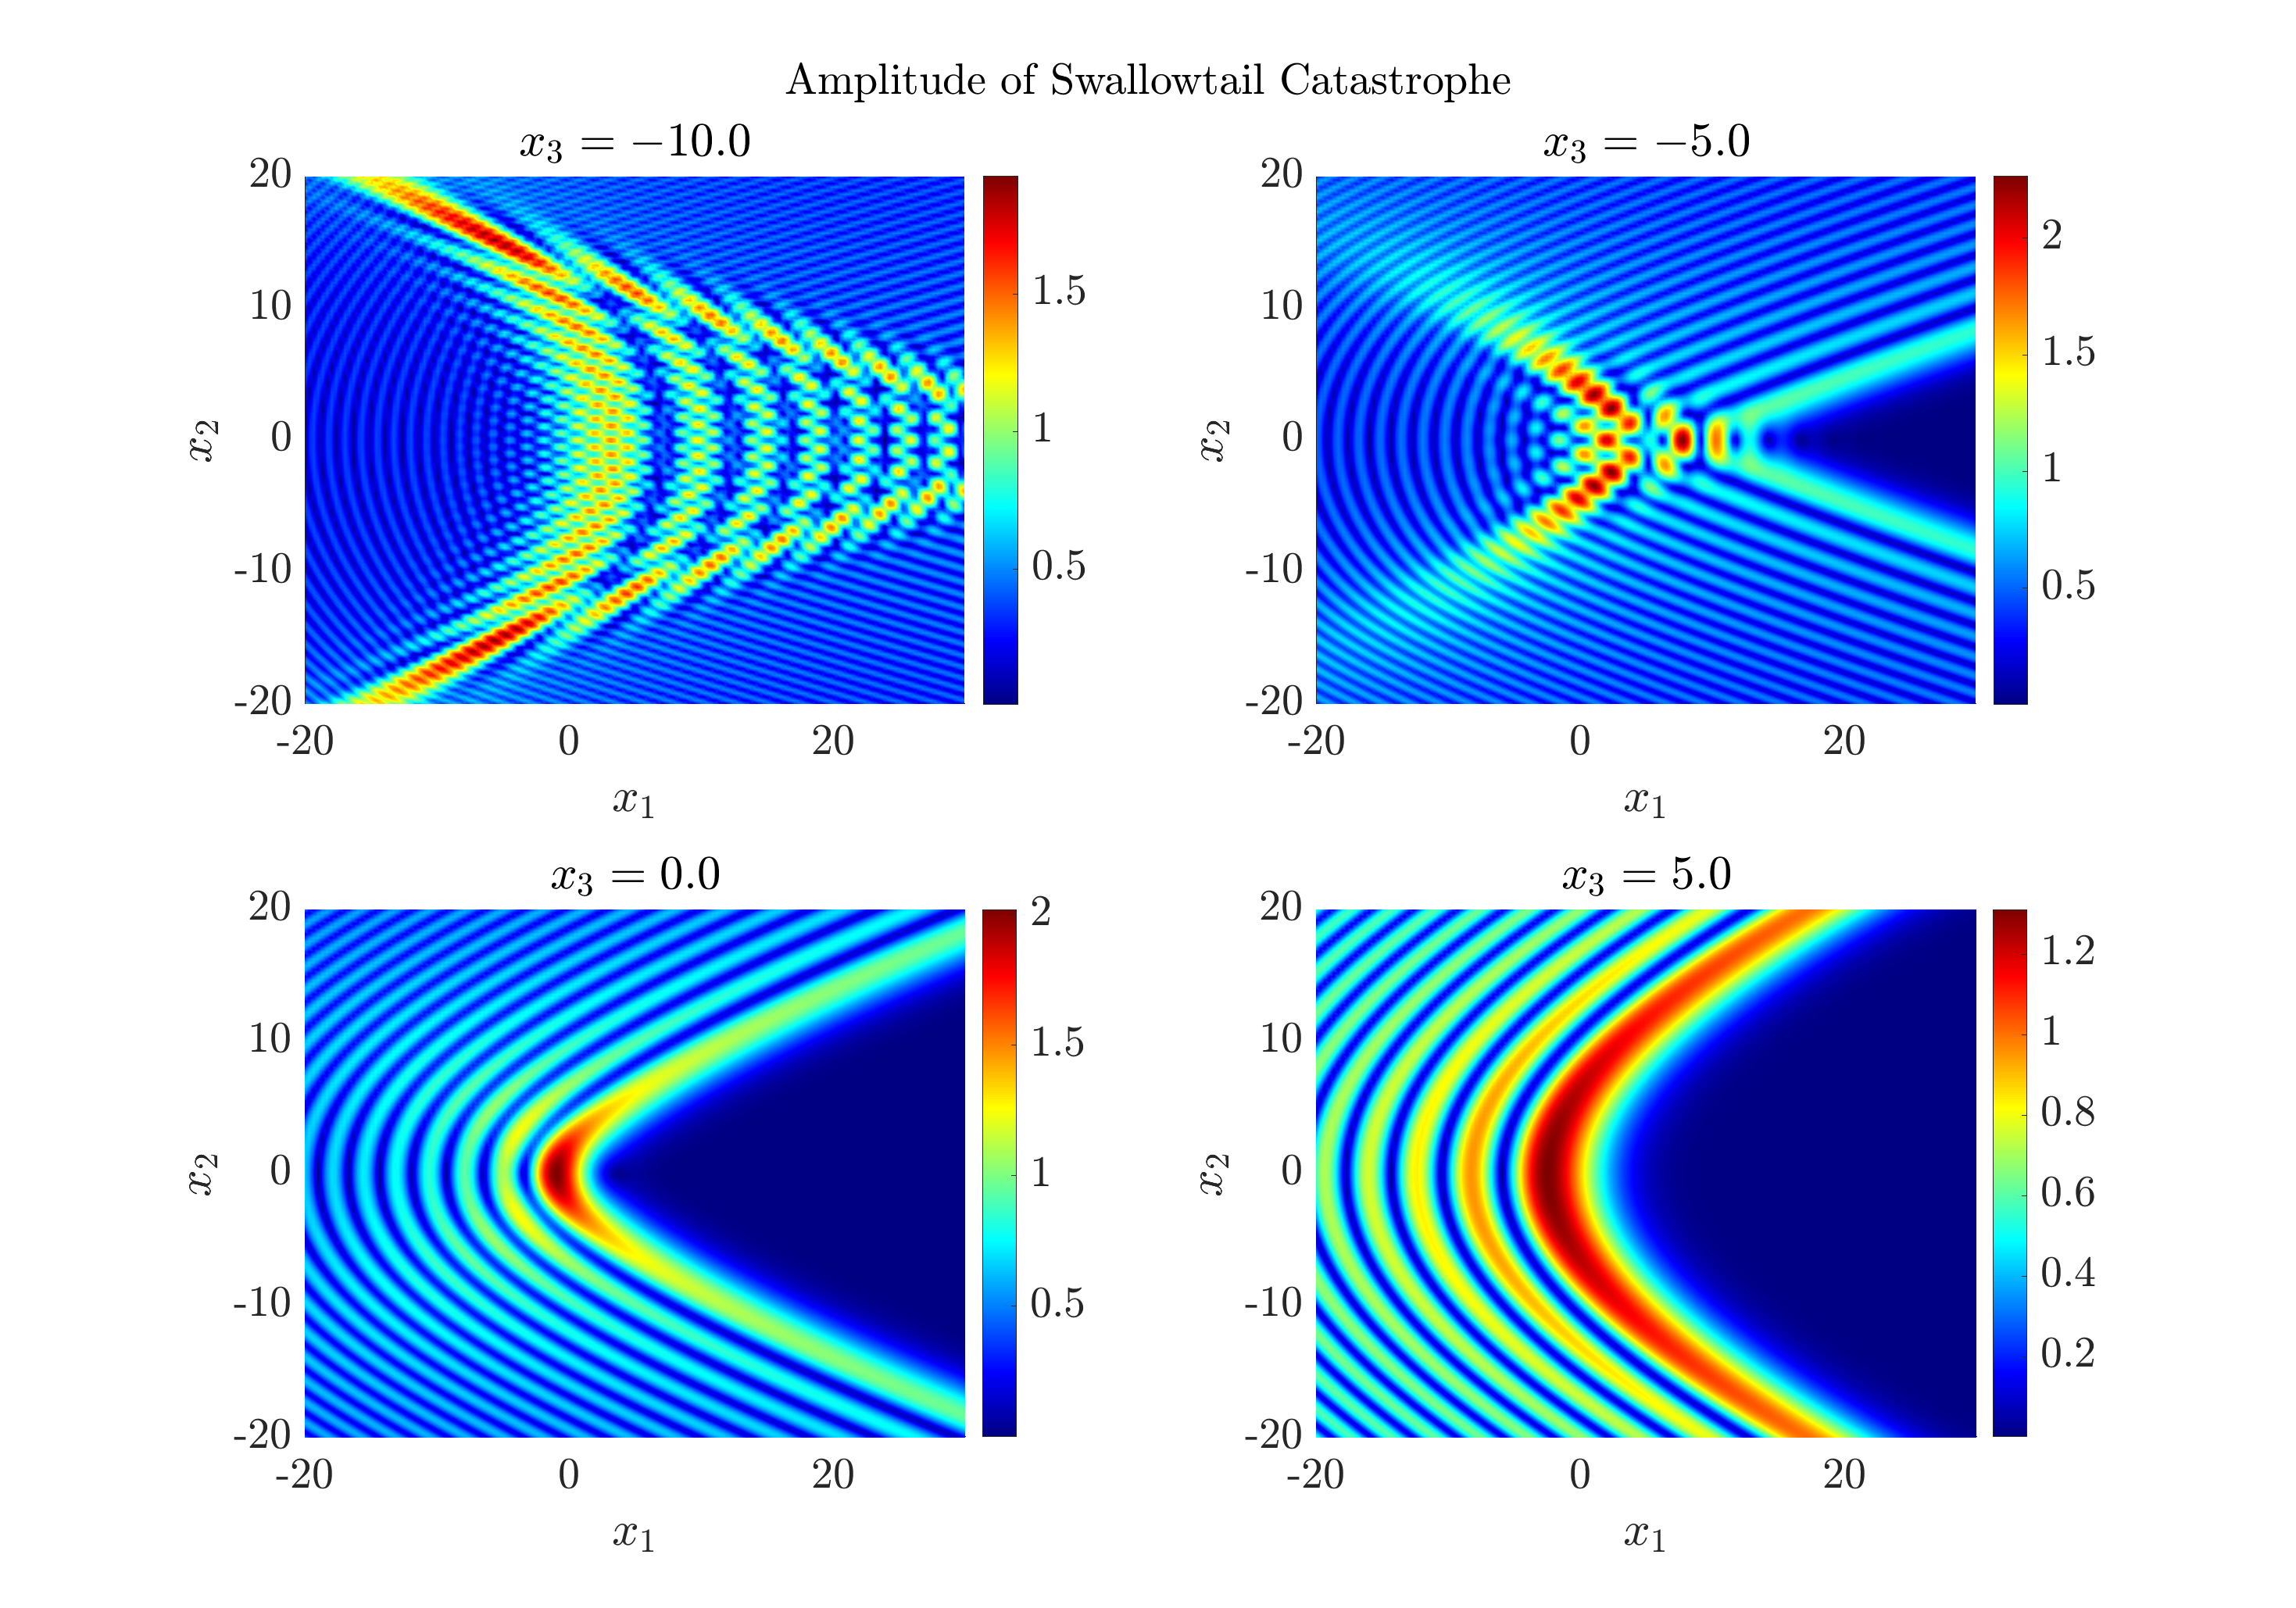
plotEGs.mproduces the contour deformation plot and graph shown above.stdComparison.mis an example where the phase \(g\) has coefficients based on the digits of \(\pi\). First, the contour deformation is plotted for a range of \(\omega\), to demonstrate how this is affected by frequency (in contrast to standard steepest descent approaches). Second, the performance of PathFinder is compared to Matlab/Octave’sintegralroutine. The digits of agreement and CPU time are compared.airyApproxuses PathFinder to approximate the Airy function of the first and second kind, based on the integral representation (9.5.4-9.5.5) of NIST Digital Library of Mathematical Functions [2023]. First, this approximation is validated against the Matlab/Octave routineairy. Second, PathFinder’s contour deformation is plotted for a range of input arguments, showing different topological behaviour.cuspCatastrophe.mproduces a plot of the Pearcey/Cusp canonical Catastrophe integral (36.2.4) of NIST Digital Library of Mathematical Functions [2023]. This is an interesting application of PathFinder, as each point in \(\mathbb{R}^2\) corresponds to a different phase function.swallowtailCatastrophe.mproduces various slice plots of the Swallowtail Catastrophe integral (36.2.4) of NIST Digital Library of Mathematical Functions [2023]. Now each point in \(\mathbb{R}^3\) corresponds to a different phase function.Octave_notebook_egs.ipynbis an Octave notebook hosted by MyBinder, which can be run in a browser, without having to download any software. As we are unable to compile MEX functions in this remote container, these examples are much slower than they would be running locally.